Dataviz Caveats
There are many ways to break a graph. Here is a list of the most common dataviz caveats and how to fix them, each illustrated as a little flashcard.
Misleading charts
Avoid cherry-picking data
Draw proportions accurately
Respect time intervals
Show the sample size
Wrong chart type
Maybe you don't need a map
Two groups? Try a dumbbell plot
Color
Optimize background colors
Color contrast
Avoid pure, flashy colors
Use a sequential palette for numbers
Too many colors kill the story
Don't use a gradient for groups
Diverging data, diverging palette
Think of colorblind readers
Design
Align everything with something
Two fonts are enough
Do you really need that box?
Font size matters
Group what belongs together
Make the title say something
Maps
Don't move countries around
Beware of the Mercator projection
Show missing data as missing
Don't let small regions disappear
Labels and legends
Minimize the use of legends
Don't put labels on top of the data
Round your numbers
Don't label every tick
Dashboards and data stories
Share the y-axis to compare charts
Use margins between charts
Link charts that share an axis
Other
Z-index matters
UpSet plots
Make date axes easy to follow
More caveats
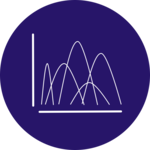 Too many distributions.If you need to compare the distributions of many variables, don't clutter your graphic.
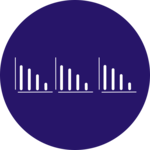 Faceting: horizontal or vertical?Placing the individual plot horizontally or vertically is an important choice to make.
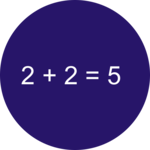 Calculation errorsAlways double-check the values written on the chart. Does your sum make sense?
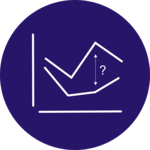 Mental arithmeticDon't ask the reader to do mental arithmetic, it is hard to compare shapes.
 Area is a poor metaphorHuman brains struggle to translate areas to precise values. Prefer other shapes.
 Grouped barplots must be groupedIn a grouped barplot, bars in the same group must be close one to each other. It makes grouping obvious.
 Mind your legendA few tips for a useful legend. Hint: you should worry if you have 14 groups.
 Spider chart and its caveatsSpider or radar charts are often criticized in dataviz, here is an overview of the topic.
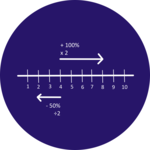 How to read a log scaleComparing percentage change on a linear scale can be misleading, use a log scale instead. By datawrapper.
 There is no 'L' in choroplethAnd people won't miss an opportunity to make you notice..
❤️ Enjoying the project? ❤️
Dive deeper into the world of data visualization with Dataviz Universe, my newsletter packed with actionable tips and tricks to enhance your data storytelling skills.