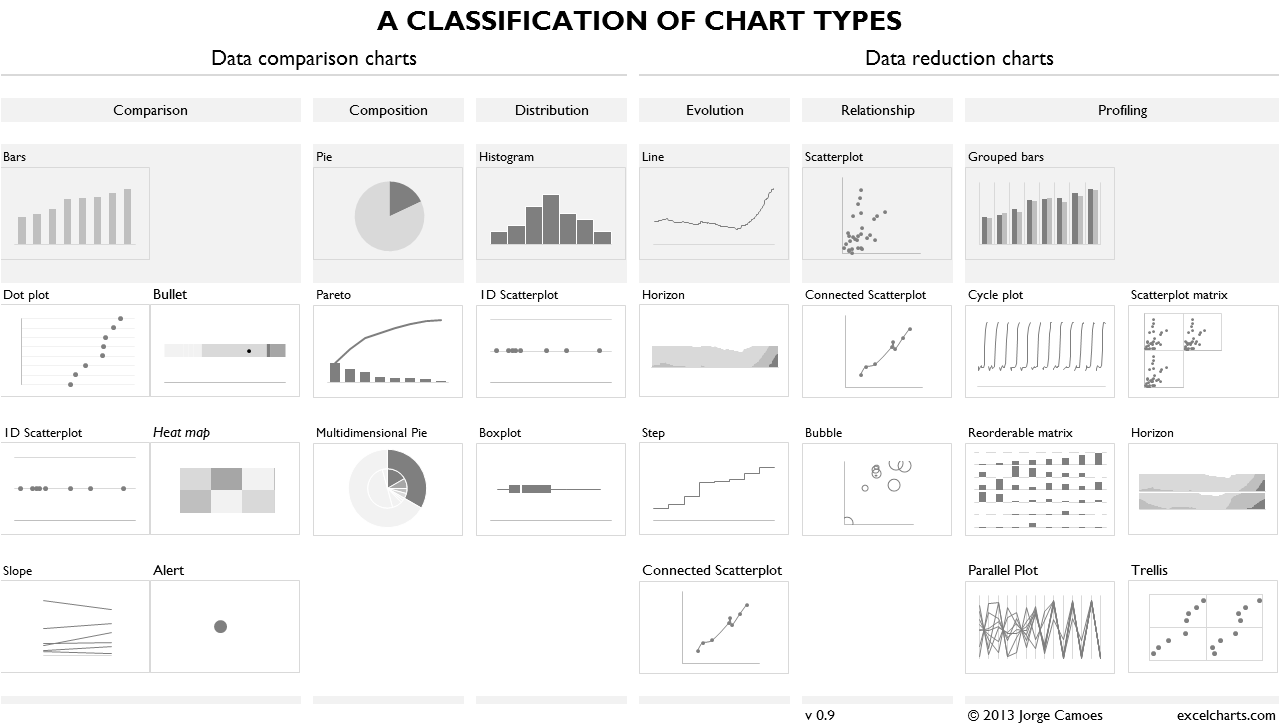
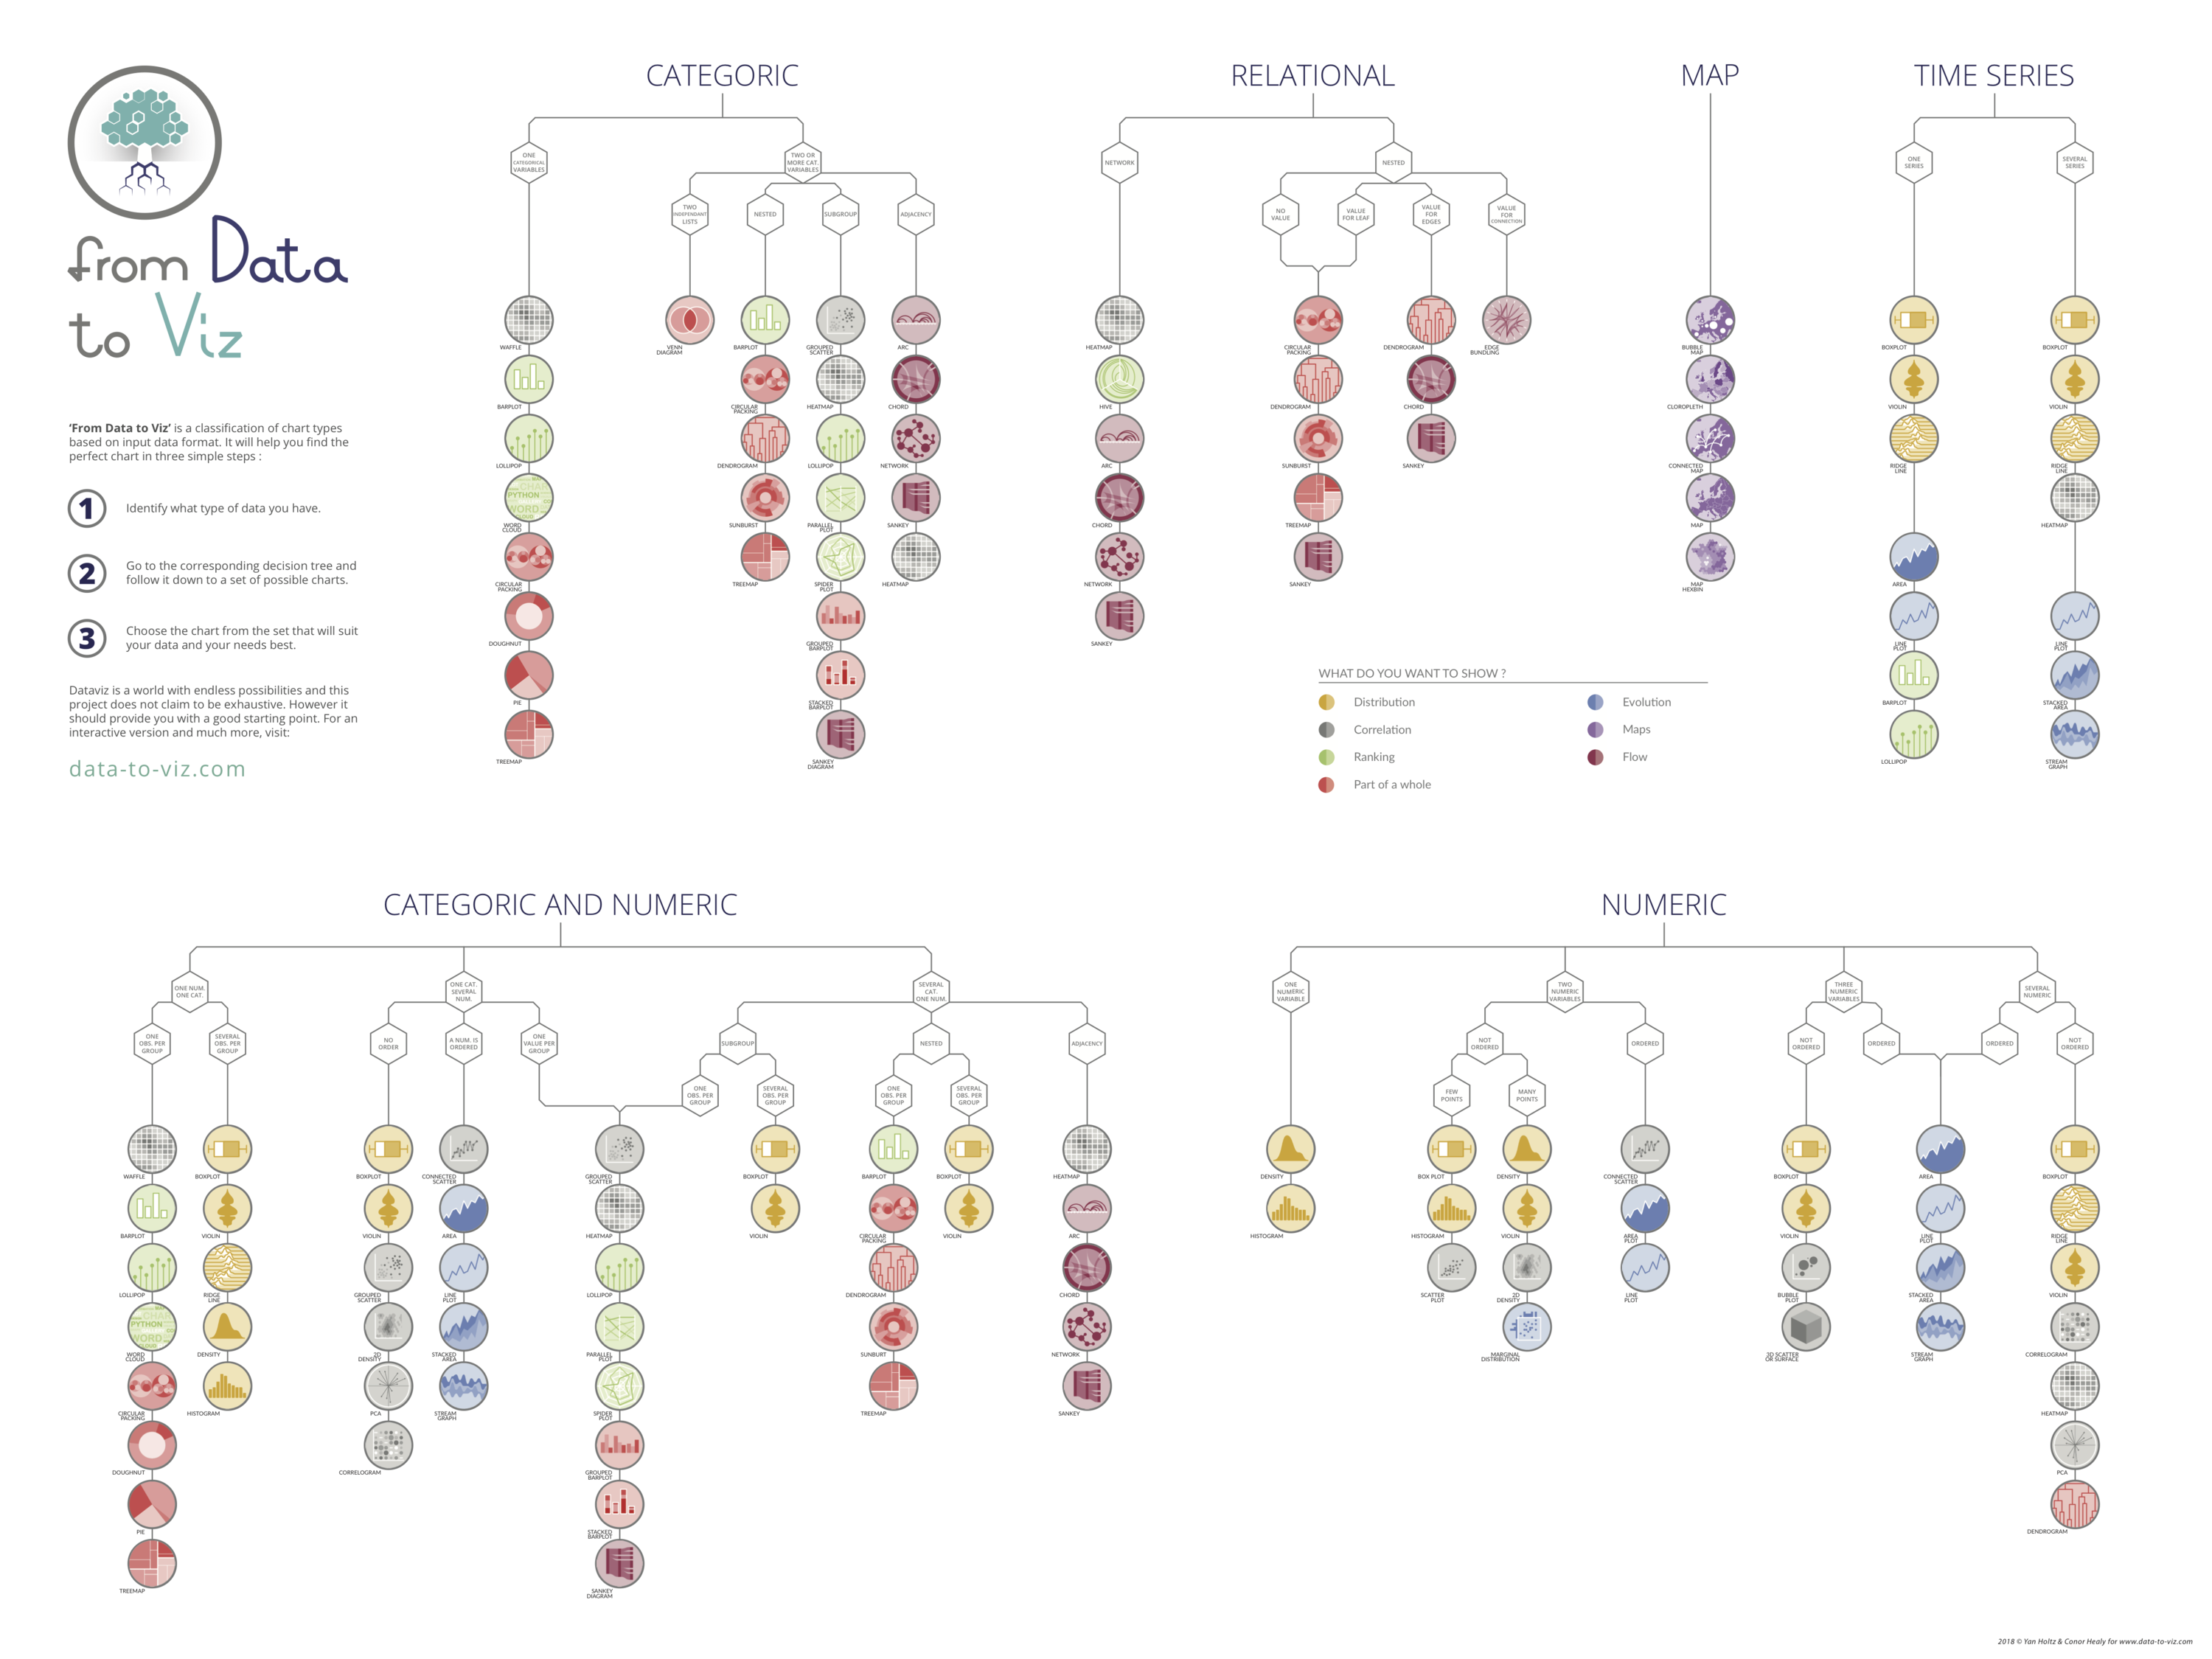
From Data to Viz is a classification of chart types based on input data format. It comes in the form of a decision tree leading to a set of potentially appropriate visualizations to represent the dataset.

The project is built on two underlying philosophies. First, that most data analysis can be summarized in about twenty different dataset formats. Second, that both data and context determine the appropriate chart.

Thus, our suggested method consists in identifying and trying all feasible chart types to find out which suits your data and idea best.

Once this set of graphics is identified, data-to-viz.com aims to guide you toward the best decision. It also provides a list of common caveats to avoid and always provides a reproducible code snippet in the R programming language.

Dataviz is a world with endless possibilities and this project does not claim to be exhaustive. However, it should provide you with a good starting point.

How is built this website?


Website

Data to viz is based on a bootstrap template and hosted on github. Logos, trees and poster have been made by Conor Healy and animated using CSS and D3.js.

Content

The vast majority of the pages of this website are built using R Markdown with the R studio IDE. Dataset used in example are all listed in this github repository.

Graphics

All analysis are made using the tidyverse, notably dplyr and ggplot2. Interactive graphics are made using html widgets, notably plotly and its ggplotly function.

Graphic classification history

From data to viz is not the first project aiming to classify the different form of data visualization. Here is a quick overview of this history:.

2017 | Your guide to great graphs by Ann K. Emery is a two pages poster that outlines 42 great graphs that showcase trends over time, by geography, and more. Note that an interactive version is available.
2016 | The chart guide by Michiel Dullaert. Initially created to help students choose the right chart.
2015 | The visual vocabulary by the Financial Times Visual Journalism Team. Aims to assist designers and journalists to select the optimal symbology for data visualisations. A interactive version is also available.
2014 | The graphic continuum by John Swabish and Severinno Ribecca. Described as a view of the many different types of visualizations available to us when we encode and present data. This poster got a Information Is Beautiful award.
2013 | A classification of chart types by Jorge Camoes. This classification includes only charts that can be made using excel.
2006 | The Chart Chooser by Dr. Abela. A simple representation that is part of the extreme presentation method. This representation has been criticized by Stephen Few, and discussed by many people in the comment section.
2018 | From data to viz by Yan Holtz and Conor Healy is a new approach aiming to classify chart types according to their input format.


Acknowledgment

This project would not exist without several blogs and website I consult on a daily basis. Even if they are not necessarily cited as sources, they are an essential source of inspiration.


Websites

R packages

People