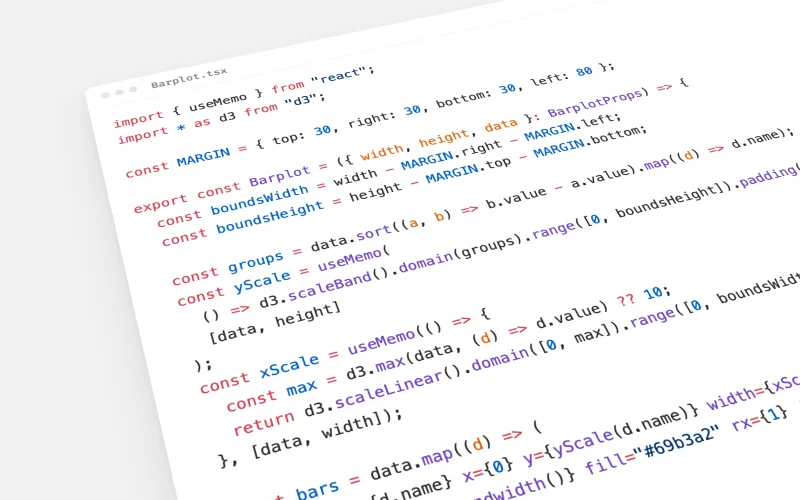
What it does
- Uses D3 for the math only (scales, shapes, layouts) and React for the rendering.
- Sets up margins, axes as React components, and a responsive wrapper.
- Switches from SVG to canvas when there are too many marks.
- Animates transitions with Motion.
When to use it
When you build a chart with D3 in a React or Next.js app. For vanilla D3, without React, it is not the right fit.