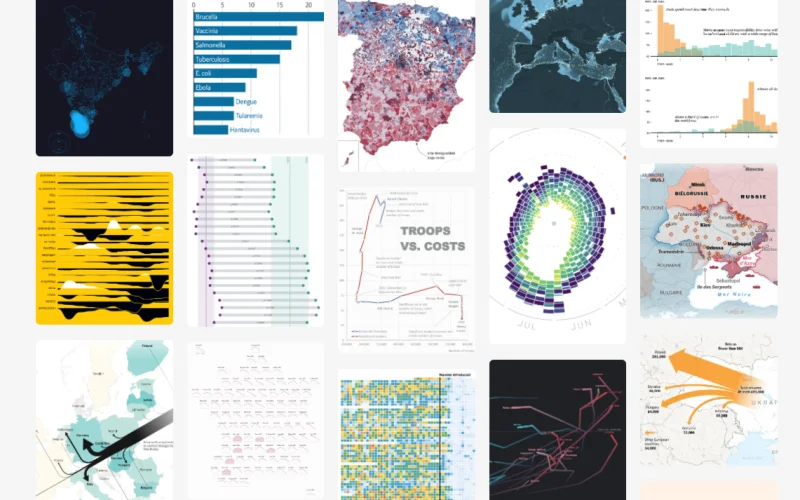
AI Skills for Better Data Visualization
By Yan Holtz, for people who want to build better graphs.
No install. Give your AI the link of a skill and ask it to follow it.
Read https://github.com/holtzy/dataviz-skills/blob/main/roast-my-chart/SKILL.md
and use it to review the chart I attached.Works with any assistant that can open a URL. Otherwise, paste the content of the SKILL.md file instead.
01
Code
Clean, idiomatic plotting code in your favorite library.
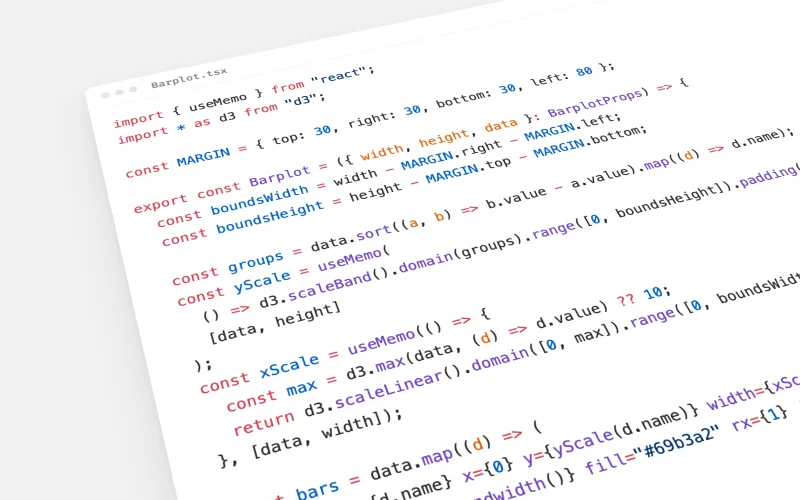
D3.js + React
Build, fix or animate a D3.js chart inside a React or Next.js app.
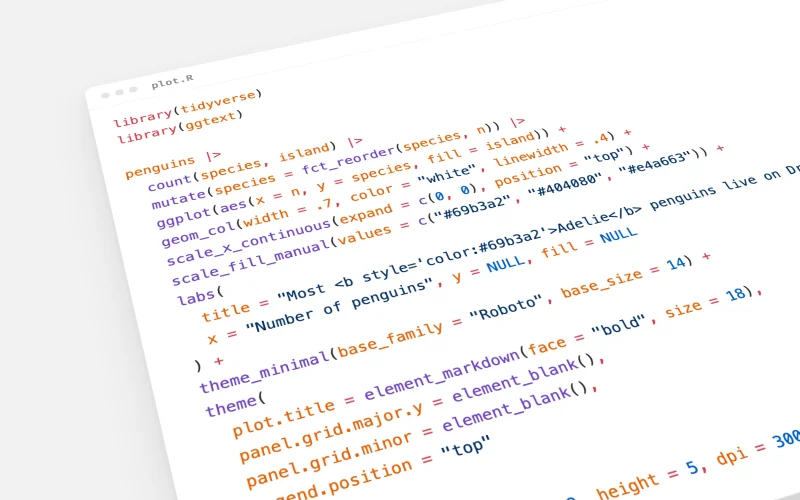
ggplot2
Publication-ready charts in R, following an opinionated set of ggplot2 best practices.
With Cédric Scherer
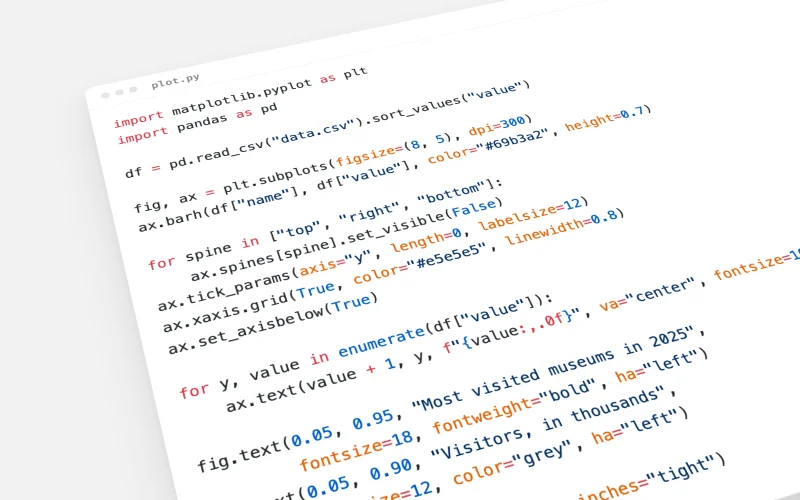
Matplotlib
Publication-ready charts in Python with Matplotlib and Seaborn: styling, annotations, layouts and maps.
With Joseph Barbier
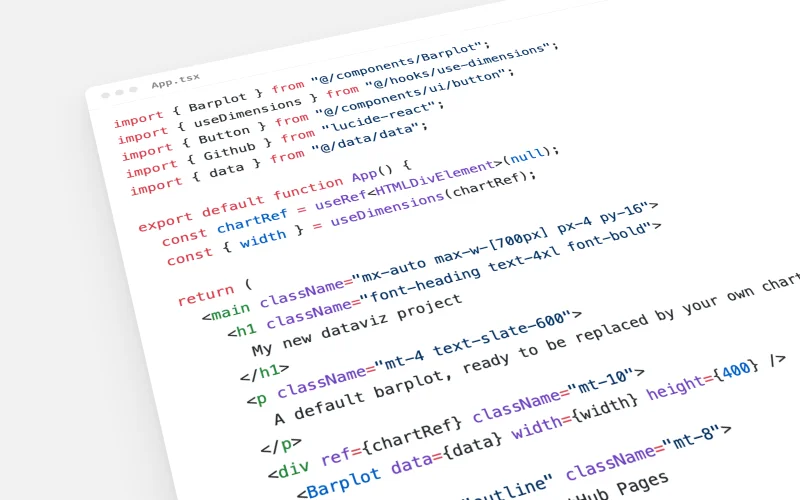
New dataviz project
Start a web dataviz project with React, TypeScript, D3 and Tailwind, ready to deploy on GitHub Pages.
02
Roast
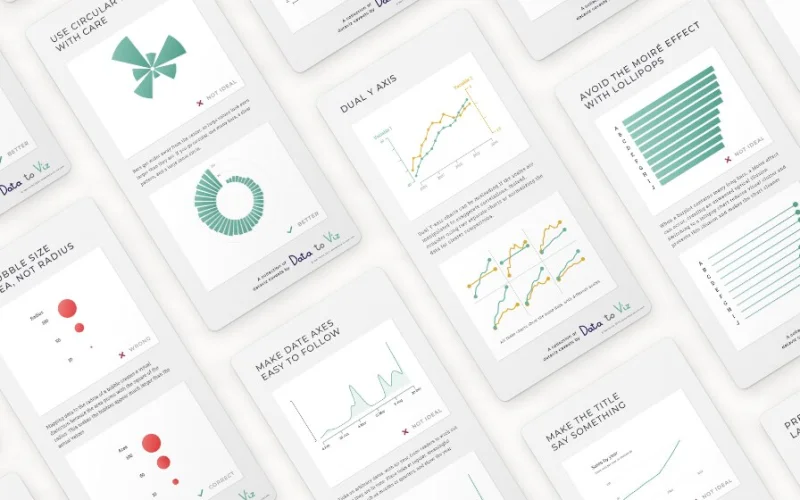
Review a finished chart and get a list of what to fix.
03
Inspiration
Find published charts to borrow ideas from before drawing.