What it does
- Checks all 61 dataviz caveats, and flags only what it sees in your chart.
- Says what is wrong and how to fix it, with code if you share code.
- Ranks the fixes: 🔴 misleading, 🟠 hard to read, 🟡 polish.
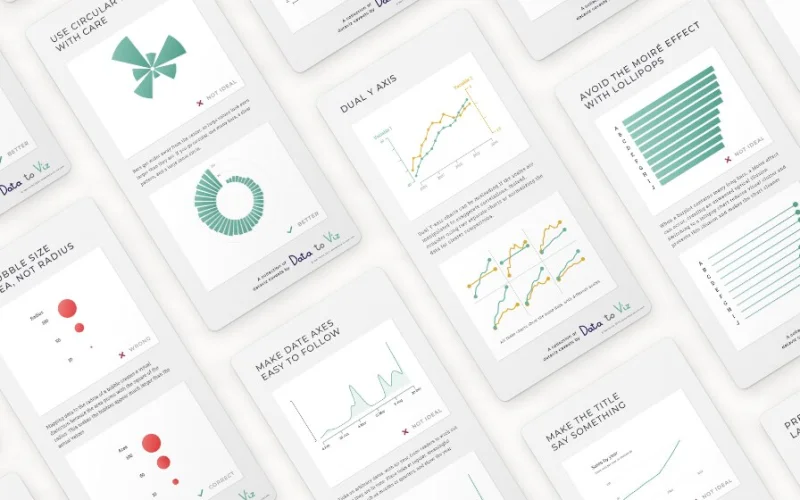
- Links each fix to its flashcard.
When to use it
Before you publish a chart. Share a screenshot or the plotting code, and ask your AI to roast it.