What it does
- Sets up React and TypeScript, with D3, shadcn/ui, Tailwind and Lucide icons.
- Adds nice, self-hosted fonts and a narrow reading column.
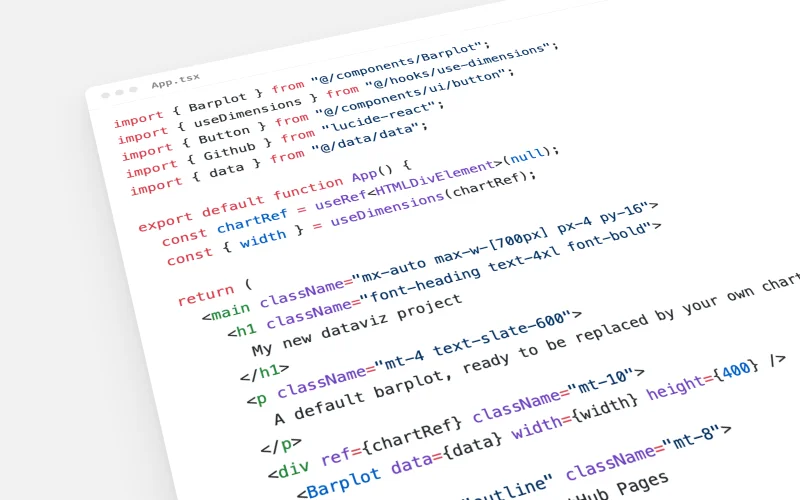
- Draws a default responsive barplot, following the D3 skill.
- Deploys to GitHub Pages on every push.
When to use it
When you start a new dataviz website or chart project. You only have to replace the barplot with your own charts.