What it does
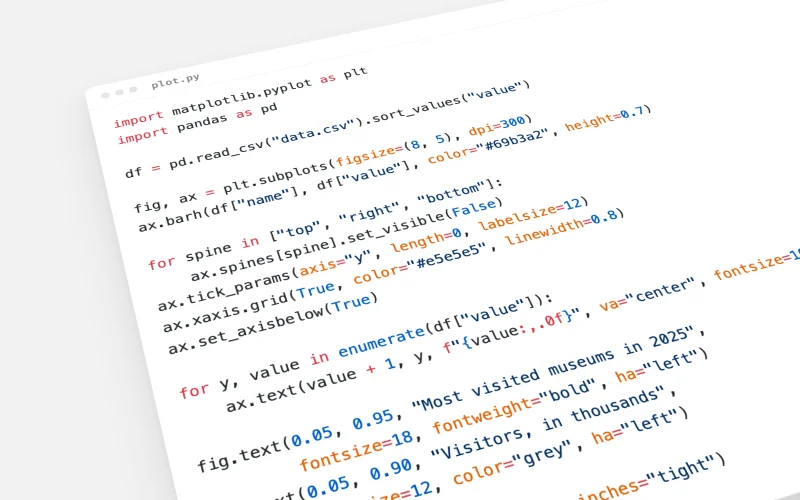
- Uses the object-oriented API and builds the figure deliberately.
- Styles for the reading task: theme, text and annotations.
- Builds layouts around comparisons, and maps with a proper projection.
- Renders the chart, looks at it, and refines it.
When to use it
Whenever you create or polish a Matplotlib, Seaborn or GeoPandas chart. It covers the code: the chart design comes from the other skills.