
Background Map
definition - mistake - related - code
A background map is a type of visualization that uses a
geographical map as the backdrop to display data points or regions. The
data is overlaid on the map, allowing for a spatial understanding of the
information. Background maps are often used to visualize data that is
tied to a specific location, such as population density, crime rates, or
weather patterns.
library(maps)
# the map library contains many maps. Here is the world map
map('world', col="grey", fill=TRUE, bg="white", lwd=0.05, mar=rep(0,4), border=0, ylim=c(-80,80) )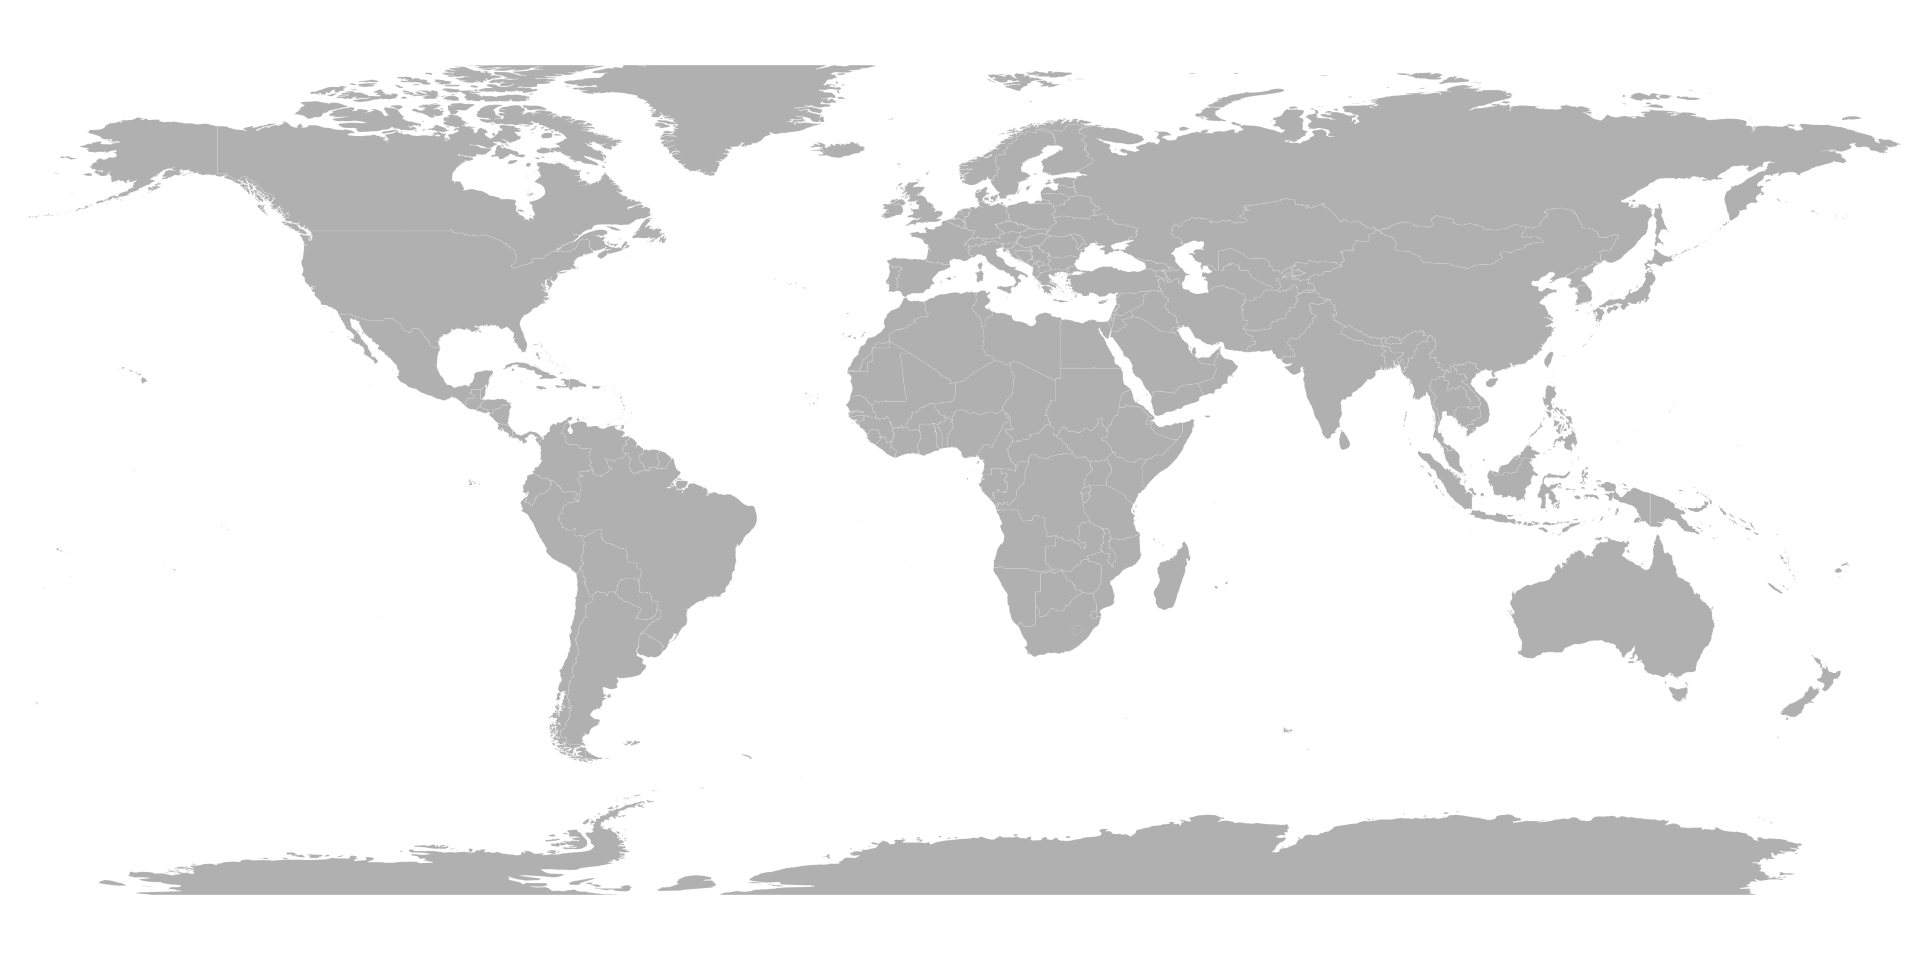
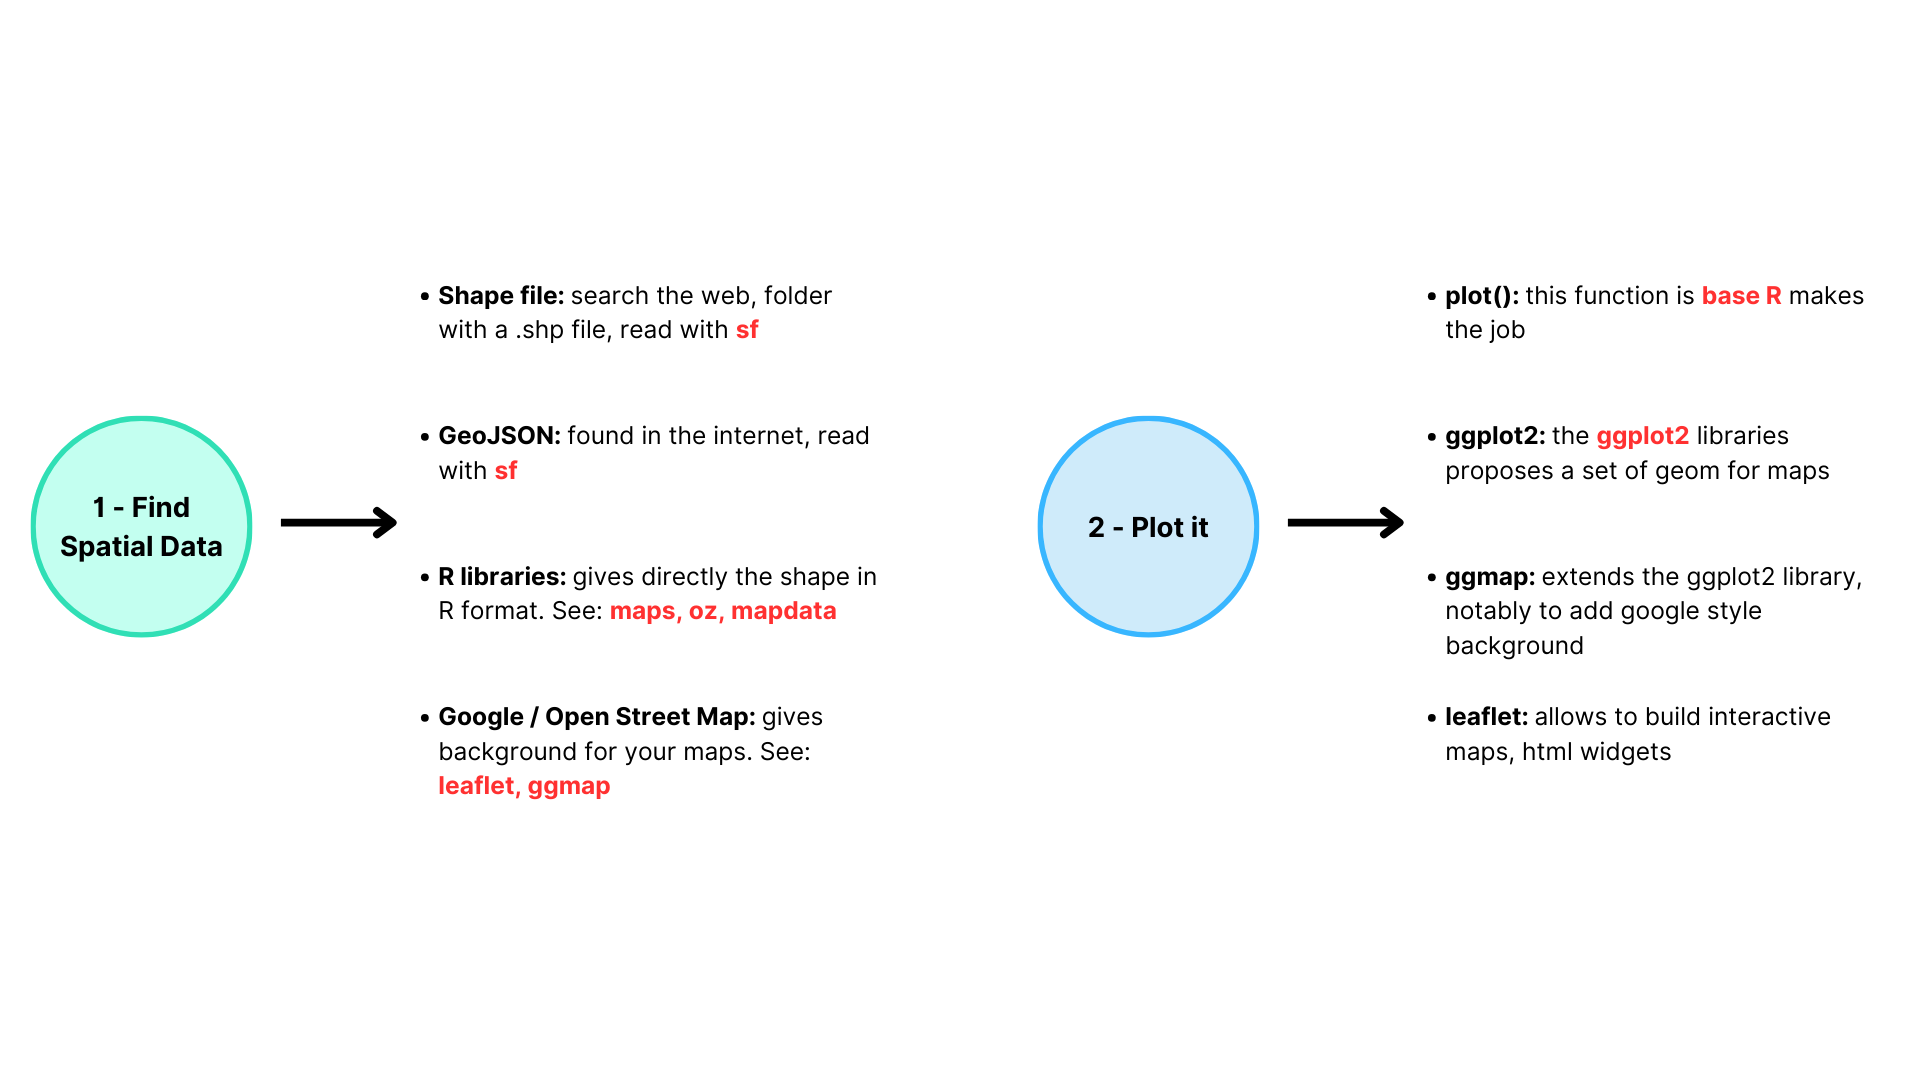
R offers multiple avenues for generating background maps. One such
method is by utilizing the maps package, which enables the
creation of maps for the world, continents, or individual countries.
However, it’s worth noting that this package might not be the most
suitable choice for more intricate or
specific mapping objectives.
Below you can find an example of the process of working with maps in R.
Background maps are usually just the starting point for a visualization. They provide the foundation for displaying data in a spatial context.
Then, one will generally transform it into one of the following types of visualizations:
Data To Viz is a comprehensive classification of chart types organized by data input format. Get a high-resolution version of our decision tree delivered to your inbox now!

A work by Yan Holtz for data-to-viz.com