
Treemap
definition - mistake - related - code
A Treemap displays hierarchical data as a
set of nested rectangles. Each group is represented by a rectangle,
which area is proportional to its value. Using color schemes and or
interactivity, it is possible to represent several dimensions: groups,
subgroups etc.
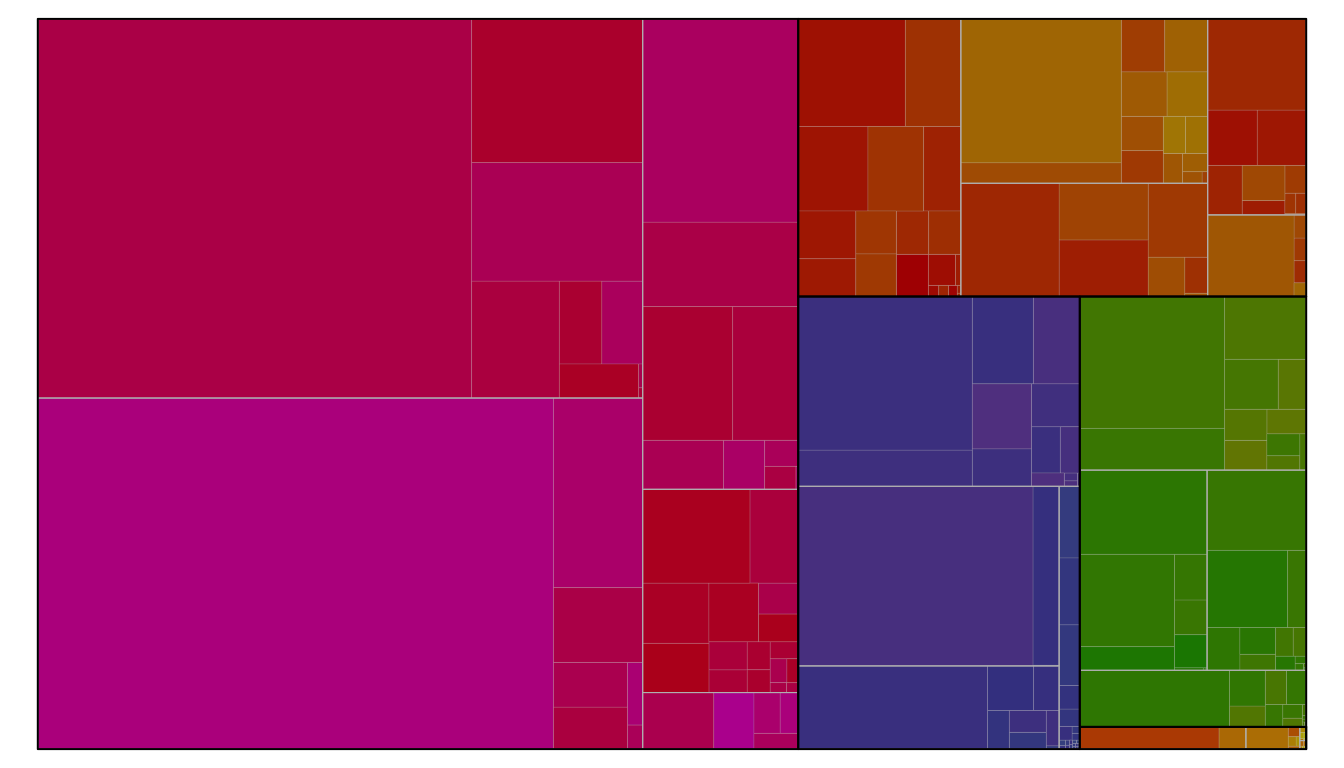
Here is an example describing the world population of 250 countries. The world is divided in continent (group), continent are divided in regions (subgroup), and regions are divided in countries. In this tree structure, countries are considered as leaves: they are at the end of the branches.
# libraries
library(tidyverse)
library(treemap)

# Load dataset from github
data <- read.table("https://raw.githubusercontent.com/holtzy/data_to_viz/master/Example_dataset/11_SevCatOneNumNestedOneObsPerGroup.csv", header=T, sep=";")
data[ which(data$value==-1),"value"] <- 1
colnames(data) <- c("Continent", "Region", "Country", "Pop")

# Plot
p <- treemap(data,

            # data
            index=c("Continent", "Region", "Country"),
            vSize="Pop",
            type="index",

            # Main
            title="",
            palette="Dark2",

            # Borders:
            border.col=c("black", "grey", "grey"),
            border.lwds=c(1,0.5,0.1),

            # Labels
            fontsize.labels=c(0.7, 0.4, 0.3),
            fontcolor.labels=c("white", "white", "black"),
            fontface.labels=1,
            bg.labels=c("transparent"),
            align.labels=list( c("center", "center"), c("left", "top"), c("right", "bottom")),
            overlap.labels=0.5#, inflate.labels=T

)
Note: You can read more about this story here, with many more way to visualize this dataset. Data source: wikipedia and formating by 1 and 2.
Treemaps are used to show two types of information simultaneously:
how the whole is divided: for each level of the hierarchy, it is easy to understand which entity is the most important and how the whole is distributed among entities. Treemap can even be used without any hierarchy, just to show the value of several entities like in a barplot.
How the hierarchy is organized. Note that it is hard to represent more than 3 levels on a static version tough.
Treemaps have the advantage to make efficient use of space, what makes them useful to represent a big amount of data.
The main variation of treemaps concerns the use of interactivity. It is advised to use it if you have more than 2 or 3 levels of organization to display. Indeed, treemap get cluttered in this situation otherwise.
In the figure below, clicking on a group zooms on it a reveals the underlying structure. Hint: click on the title to come back to the previous level of the hierarchy.
Data To Viz is a comprehensive classification of chart types organized by data input format. Get a high-resolution version of our decision tree delivered to your inbox now!

A work by Yan Holtz for data-to-viz.com


